

Our aim is to provide a great customer experience and to be transparent with our customers on how well we are performing.
This is our second year of our quarterly reporting, and several measures have been updated to improve accuracy and consistency with other reporting. Updated measures are clearly identified with supporting explanations in numbered footnotes, and last year’s figures have been restated to reflect the revised calculations.
Repairs
These figures show how we handled repairs and details of customer satisfaction with repairs.
You can find more information about our relevant processes on our repairs pages.
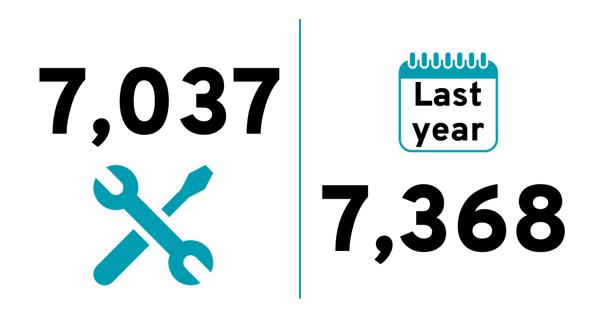
Total number of repairs completed
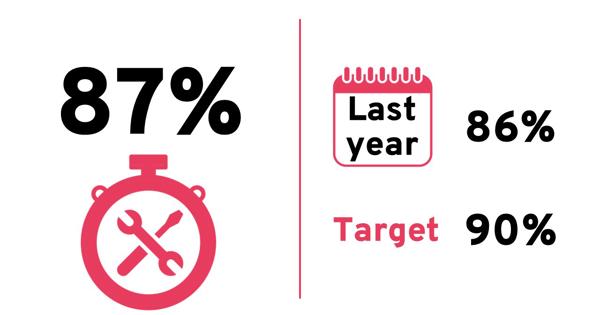
Percentage of repairs completed within target timescales - emergency
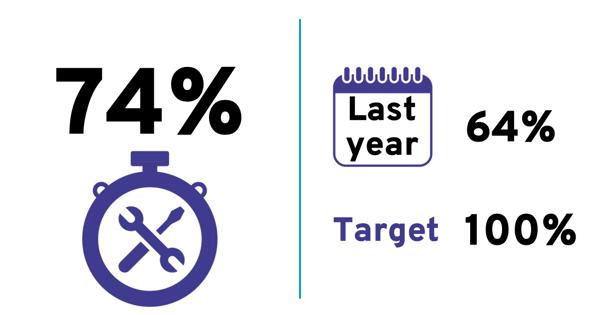
Percentage of repairs completed within target timescales - non emergency
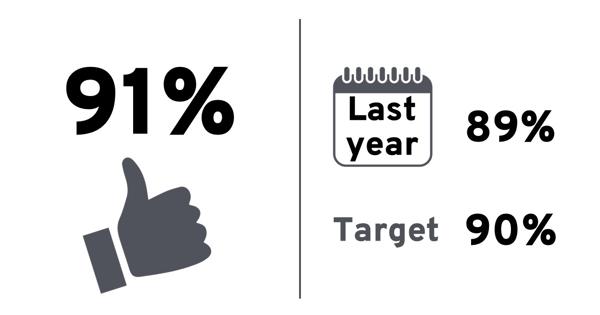
*Customer satisfaction with repairs
Improving homes
These are the latest statistics regarding our progress to improve homes.
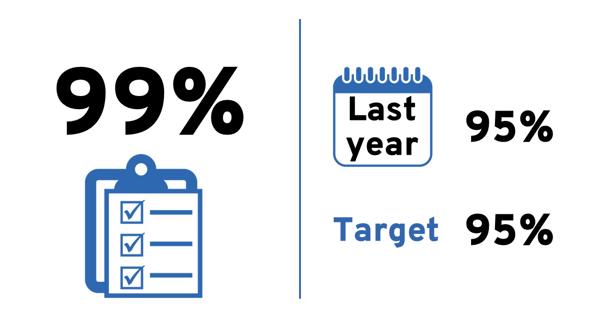
Homes with an up-to-date Home Improvement Survey
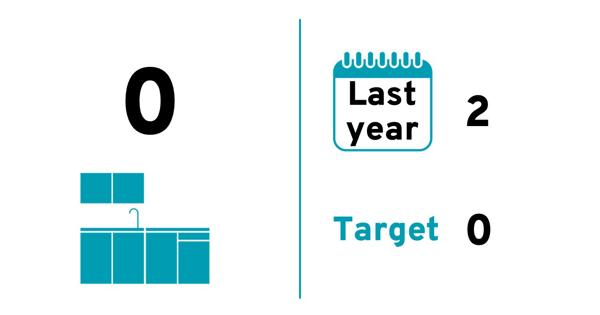
New kitchens delivered so far this year
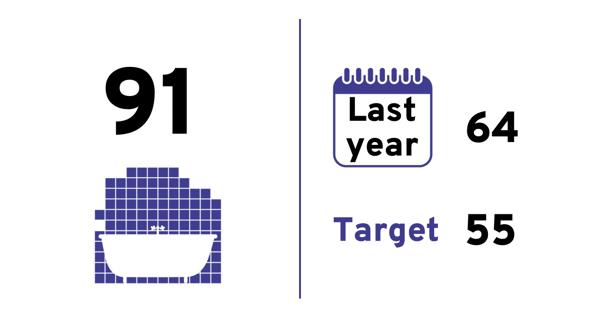
New bathrooms and wet rooms delivered so far this year
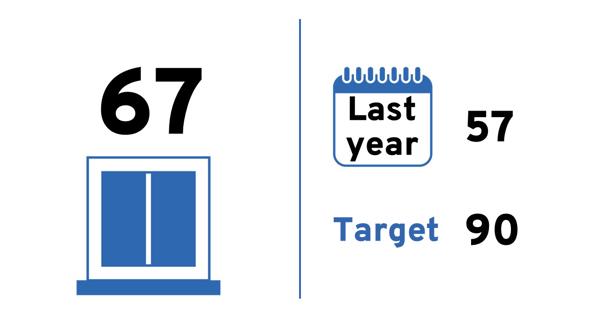
New windows delivered so far this year
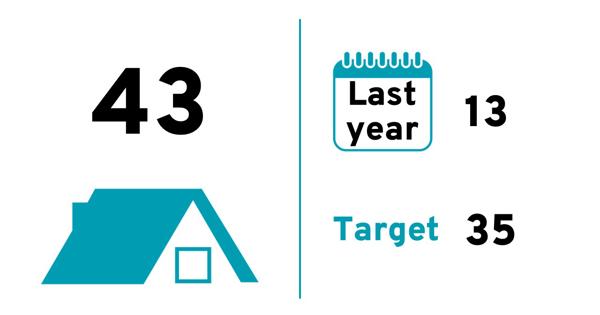
New roofs delivered so far this year
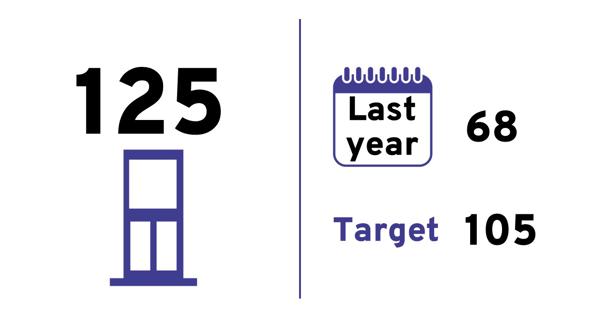
New doors delivered so far this year
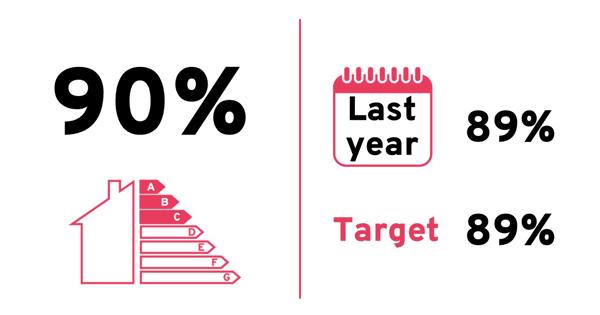
Homes with an Energy Performance Certificate above C
Responding to customer contacts
These statistics relate to how we handled our contacts with customers.
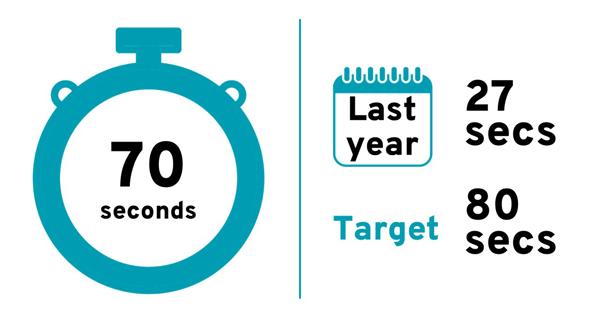
Average call wait time
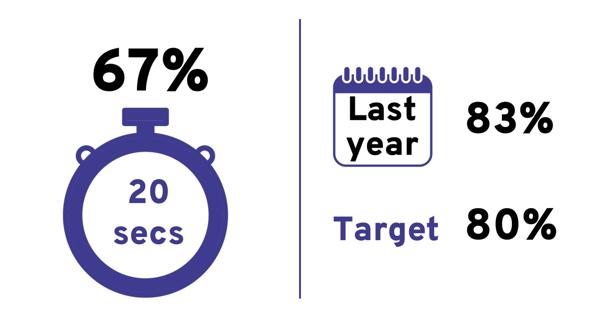
Calls answered within 20 seconds
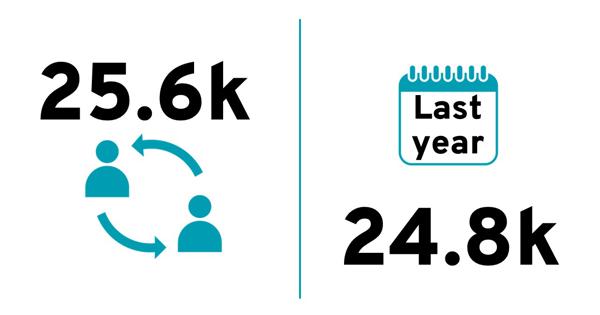
Total contacts received by the contact team
Tenancy
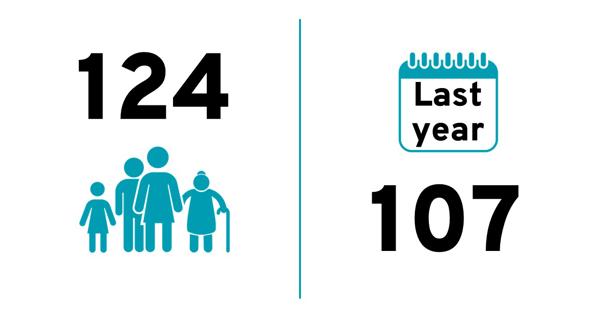
Number of new tenancies
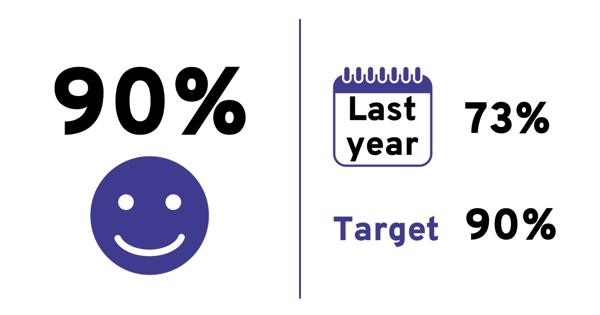
*New tenant satisfaction
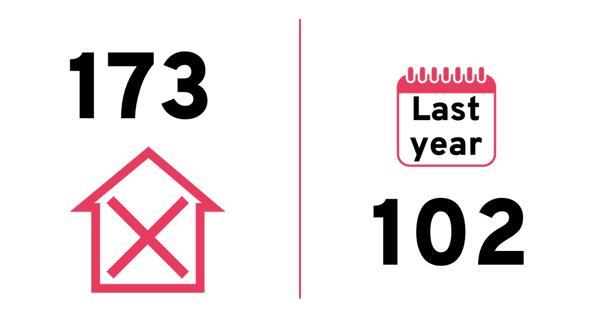
Number of empty homes (being prepared to re-let and excluding homes under consideration)
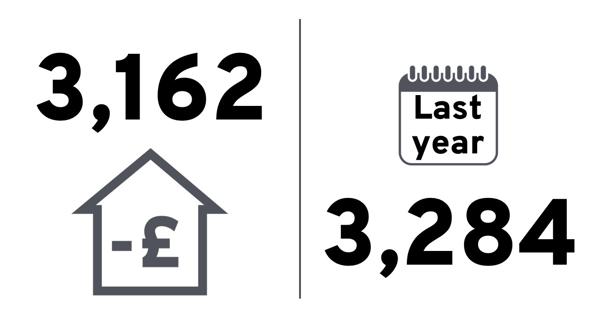
Number of customers in rent arrears
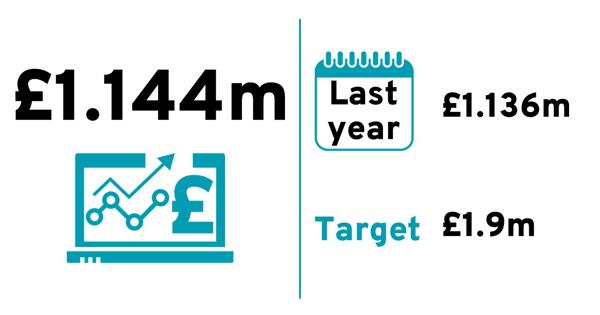
Value of rent arrears
Formal complaints
The number of complaints we receive and how we handle them against the Housing Ombudsman's requirements and how satisfied customers were with the handling of their complaint.
Further details about our processes can be found on our complaints, comments and compliments page
Please note that Measures for response times to Stage 1 and Stage 2 have been updated to be consistent with Tenant Satisfaction Measures. They now show response times to those stages of complaint and not the times to close those complaints.
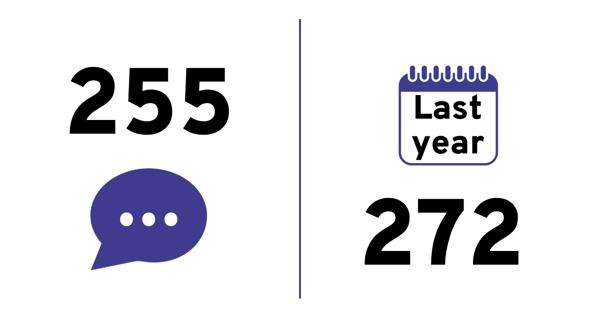
New complaints received
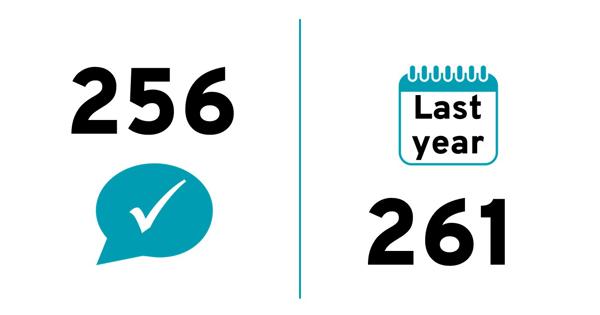
Complaints closed
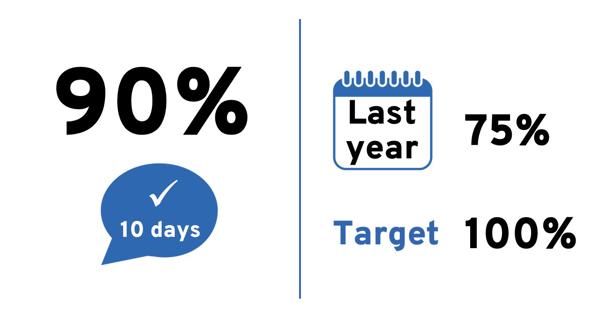
Stage 1 complaints responded to within 10 day target
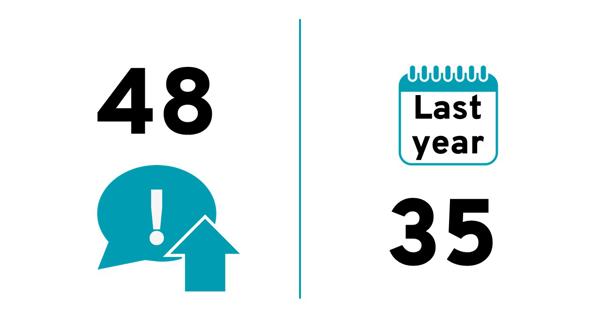
Number of cases escalated to stage 2
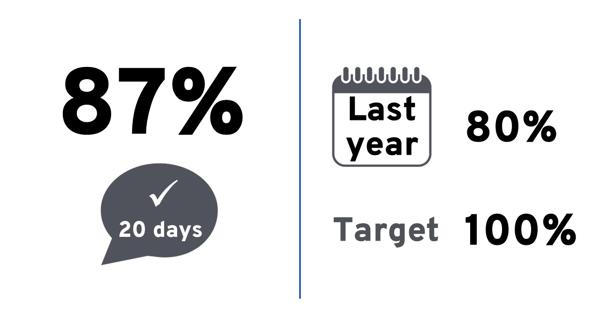
Stage 2 complaints responded to within 20 day target
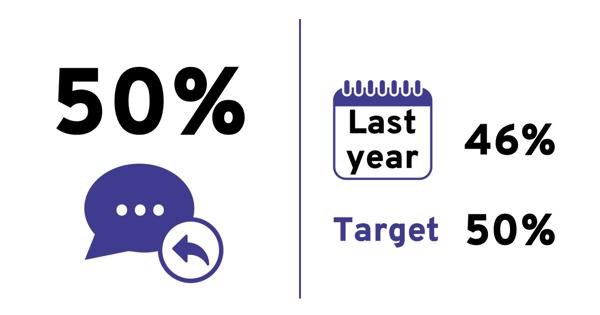
*Customer satisfaction with handling of complaints
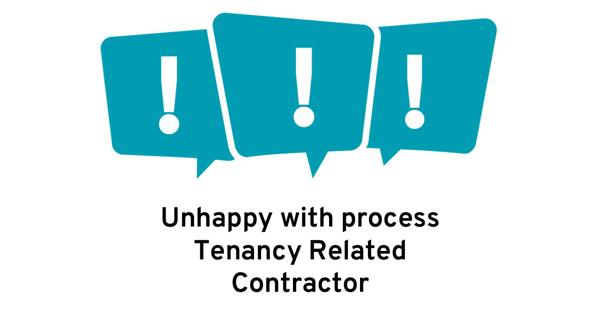
Top three complaint reasons
Community safety
Statistics which show the amount of anti-social behaviour in our homes and customer satisfaction with how well we handled them.
Further details about our processes can be found on our community safety pages.
Please note that the method of calculating antisocial behaviour cases has been updated to no longer include person alerts which are not related to anti-social behaviour.
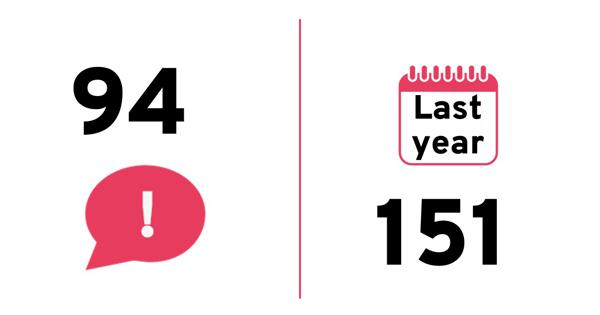
Anti-social behaviour cases reported
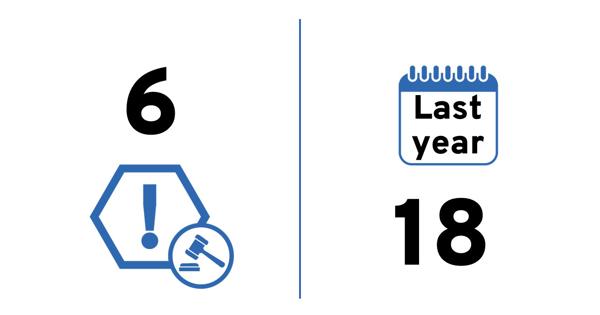
Anti-social behaviour cases where legal action has been taken
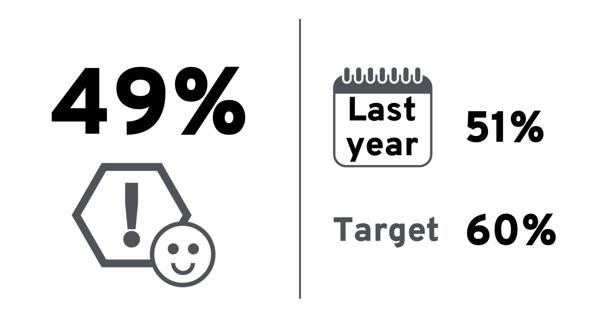
*Customer satisfaction with handling of anti-social behaviour issue
Safety servicing
We manage various elements of safety servicing, these figures show our overall figure which includes not just homes, but also communal areas and other legal requirements.
Our staying safe at home pages contain more information about our safety processes.
Please note the following points.
The calculation for the number of homes with up-to-date electrical safety certificates has been revised to only include homes, and no longer includes other properties such as commercial premises.
The calculation for homes with up to date lift safety checks has been revised to only include blocks and does not include stairlifts.
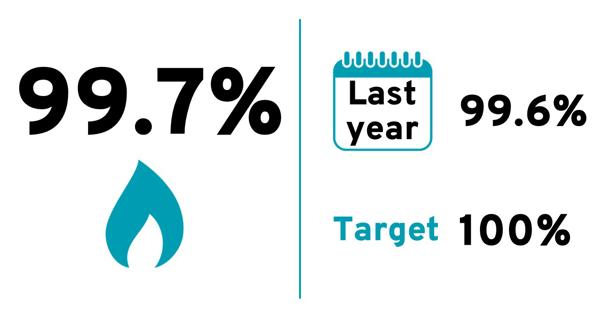
Homes with up to date gas certificates
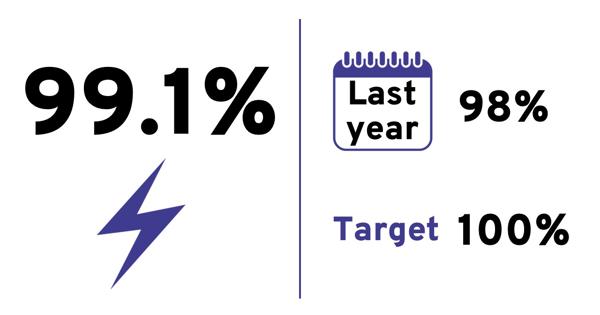
Homes with up to date electrical certificates
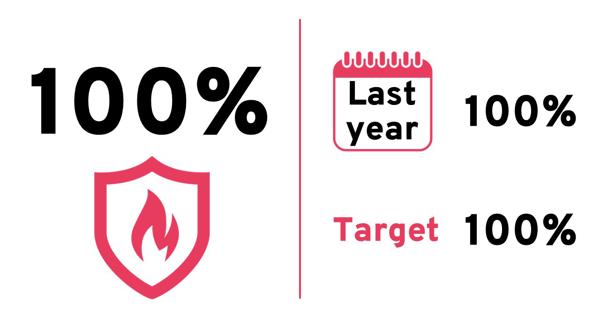
Homes with up to date fire risk assessment certificates
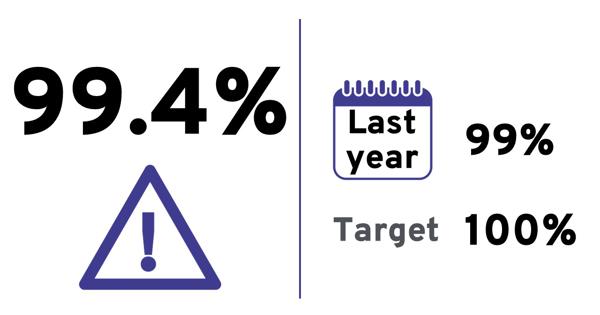
Homes with up to date asbestos inspections
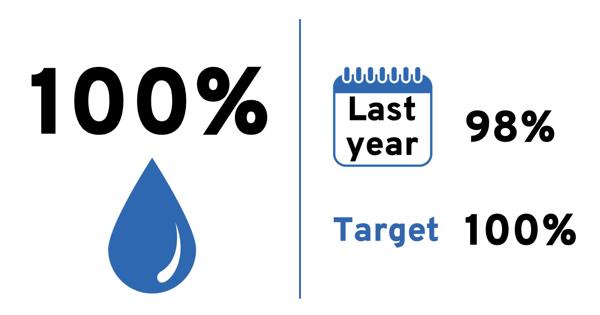
Homes with up to date water safety assessments
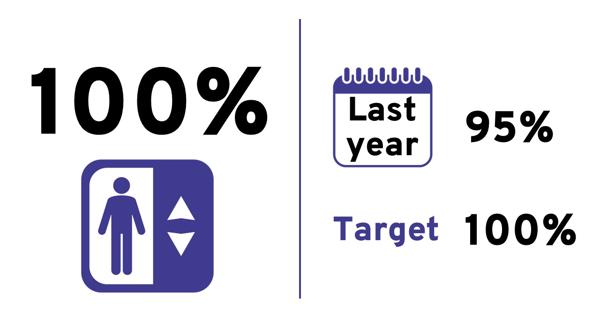
Homes with up to date lift safety checks
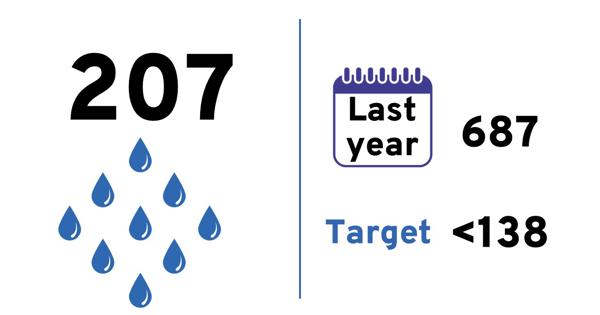
Number of open damp and mould cases
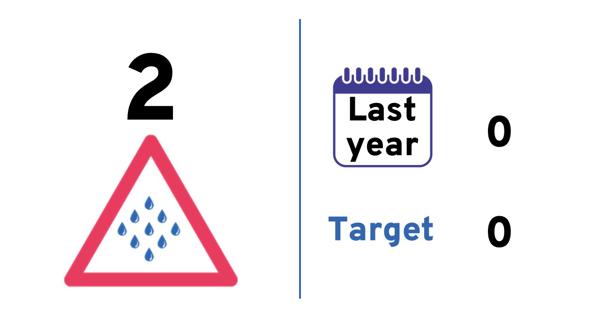
Number of open damp and mould cases classed as an emergency
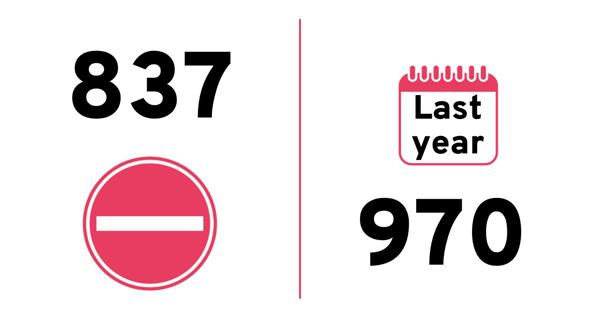
Customer missed appointment for safety visits
*Statistics marked with an asterisk are taken from our transactional surveys. Figures from the repairs survey are based on the most recent quarter, all other transactional survey data is based on the last 12 months. Surveys are designed to measure the customer experience at specific touchpoints. Transactional surveys are sent to customers immediately after a transaction, for instance, straight after a repair has been completed, or once a complaint case has been closed. This enables us to understand the customer’s recent experience of that interaction - what has gone well, and what changes we need to make to improve our service in the future.
Past reports
-
pdf 1205Kb
Quarterly Performance Statistics for the period ended 30 June 2026
-
pdf 2526Kb
Quarterly Performance Statistics for the quarter ending 31 March 2026
-
pdf 1089Kb
Quarterly Performance Statistics for the quarter ending 31 December 2025
-
pdf 2251Kb
Quarterly Performance Statistics for the quarter ending 30 September 2025
-
pdf 2253Kb
Quarterly Performance statistics for the quarter ending 30 June 2025.